

Introduction
Ruby assumes at least version 2.1. JavaScript is mostly targeted at NodeJS examples.
ChartURL is a product that enables you to turn your data into image charts for emails, reports, chat bots, & web/mobile apps. We support several charting libraries. We fully expose the API for all the charting libraries we support, so anything you can do with those Charts on the web can be done with ChartURL.
Libraries
Who are these docs for?
This is the documentation for the ChartURL Developer API. If you are looking for help with the ChartURL for Marketers product, please contact support.
Don’t know what product to use? If your desired use case is that you want to upload a data file to ChartURL and get back a file that includes links to images, then you want to use the Marketer product.
Use Cases
Embedding charts in emails is the most common use case for using ChartURL. There is no reliable way to have consistent looking charts in email without rendering them as an image.
Chat bots
JavaScript charting libraries don’t run in chat systems like Slack and Hipchat, but those products do let you embed images, and that’s all that is needed for ChartURL to work. Companies like Statsbot power their Slackbot chat charts with ChartURL.

Some charting libraries do not render correctly in PDFs, so some of our customers use ChartURL to render charts into custom PDF reports they create for their customers.
Mobile & Web
Many people want to have charts that look consistent in their company emails, their website, and their mobile apps. ChartURL is an easy way to ensure that consistency.
This is especially handy for mobile app developers who don’t want to build out a custom charting solution for their application.
Setup Guide
This guide will walk you through getting started with ChartURL.
1. Create a project
Projects are where you keep all your chart templates and set up your production
and development testing environments. We create your first project for you, and
you can add others as needed. Each project has it’s own token (for use in creating
Signed URLs) and it’s own api_key (for use in creating ShortURLs).
Projects have Project-level settings you can use to maintain consistency. This can be used to set things like typography, custom watermarks, and color palettes across all templates in the project.
2. Create a template
Create your first template by heading into a project and clicking ‘Create Template’
Give your template a name, and you can start to edit the settings.
Template Level Configurations
In a template you can add all the code to define how your chart will look. You will need to create a new template for each different chart you want to create.
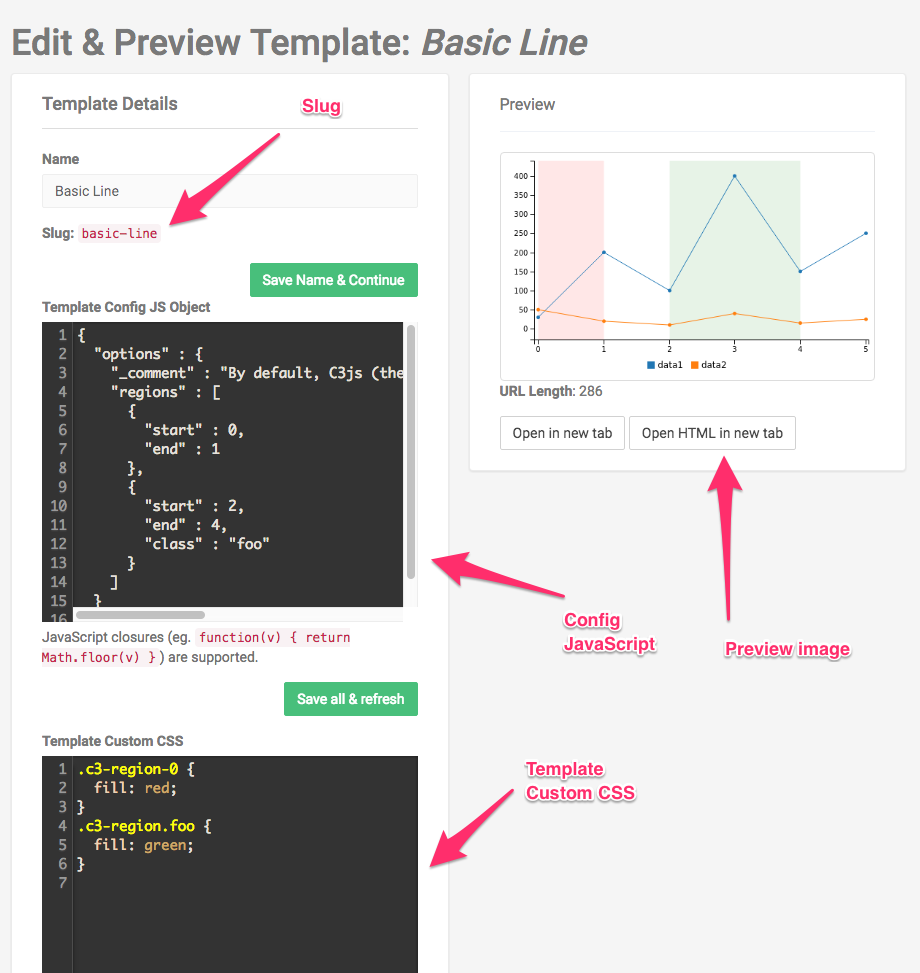
Config JavaScript Object
The Config JavaScript object is structured as follows:
| Attribute | Type | Description |
|---|---|---|
| charturl | Object | ChartURL options |
| options | Object | The object passed to the charting library |
The Config JS object is JavaScript, which means you can include closures:
function(v) { return Math.round(v) }
Custom CSS
By default, the
bodyis transparent. If sending images to a printer, change it to white.
body {
  background-color: white;
}
Use this CSS to style your chart. C3js relies heavily on CSS for styling, while ChartJS uses options passed into its constructor to style the chart.
Template Data for Preview
Example JSON for Preview
{
  "charturl": { },
  "options": {
    "data": {
     "columns": [["Series 1", 1,2,3,4,5], ["Series 2",2,3,4,5,6]]
    }
  }
}
The Preview Data is structured exactly like the Config JS object with one very big difference. The Preview Data is JSON, not JavaScript. This means object keys need to be wrapped in double quotes, and closures are not allowed.
This is where you can add example json data to test our your chart. We’ll save that test data for you to use in the future. If you want to see how some example test data looks check out one of our example templates.
Preview the chart
We provide a preview so you can see how your chart will look. Clicking ‘Save and Refresh All’ will update this preview. For troubleshooting, you can also open the HTML version of the chart in case you need to troubleshoot the code.
Project Level Configurations
When editing a template you will also be able to edit Project-level configurations for ‘JS Object’ and ‘Custom CSS’. Keep in mind this will be applied to ALL of your templates in a project. There is no other place to edit Project-level settings.
Not sure where to start? Try one of our examples.
3. Choosing a charting library
Setting ChartJS Version
{
  "charturl": { "type": "charturl", "version": "2.3" },
  "options": {
    "data": {
     "columns": [["Series 1", 1,2,3,4,5], ["Series 2",2,3,4,5,6]]
    }
  }
}
To choose a charting library, you’ll want to set the charturl.type option to the
appropriate value. Below we list out our charting libraries, show you how to choose
that library, and link to their documentation.
ChartJS 2.x
This is our recommended library for basic charts. We are currently running version 2.0.0. You can find the documentation for ChartJS here: ChartJS 2.0 Documentation
To use ChartJS, set charturl.type to chartjs.
Using a different version of ChartJS
By default, charts are rendered using version 2.0. We also support the following versions:
- 2.3
- 2.4
- 2.5
- 2.6
To use a version other than 2.0, set charturl.version to a string representing that version.
See the example to the right.
DataMaps
DataMaps lets you create charts that look like this:

And this:

And this:

It is, in a word, awesome.
We are currently running DataMaps version 0.4.0, which you can find here: DataMaps Documentation
To use DataMaps, set charturl.type to datamaps
C3.js
C3.js was the original library supported. To use it, you can leave charturl.type blank or set it to c3js.
We are currently running version 0.4.10. You can find the documentation for C3js here: C3js Documentation
4. Understanding how to setup your request-level data
We’ve already covered Project-level configuration (for things like typography, colors, or custom watermarking) and Template-level configuration (for things like chart type & chart options). A request to generate a chart will send in additional information like the data you want to chart, but you can also pass in other options that override the higher level options.
Config JS
The charturl and options objects get merged together with the Project- and
Template-level counterparts. Request-level takes precedence over
Template-level, which in turn takes precedence over Project-level.
Custom CSS
The CSS is rendered into the page in the following order:
- Project-level
- Template-level
- Request-level
Custom JS [Only available at higher pricing tiers]
The JS is first wrapped in an onready callback similar to jQuery’s
$(function() { /* ... */ }) and then the custom JS blocks are rendered in the
following order:
- Project-level
- Template-level
- Request-level
This feature is required in order to do things like create Bubbles in DataMaps.
The Custom JS feature is only available at higher pricing tiers. Contact support if you would like to have this feature enabled.
Creating Chart URLs
We support 2 different methods for generating image URLs. Read below about ShortURLs and Signed URLs to choose the method that is right for you.
Constructing a URL is free and fast. Since you don’t get charged until an image is viewed, you can create as many of these as you want.
Preferred Method: ShortURLs
ShortURLs are preferred since they completely remove the chances of running up against the ~1,500 character limit on GET strings.
This method lets you POST us as much data as you want and get back a short
URL like this: https://charturl.com/r/nXN2
The ShortURL endpoint is designed to be fast
Since we don’t render the image until the resulting ShortURL is used within an
img tag, this endpoint is very speedy. If you see response times over
20ms, contact support because something is awry.
In order to keep this endpoint fast, we don’t do any validation on the data you send us. You could send along a non-existant Template slug or you could have a typo in your JSON config, but the ShortURL endpoint would still return a 201 status code and a ShortURL regardless. Keep this is mind and be sure to test your ShortURLs before deploying them into production.
For details on how to create a ShortURL, see the ShortURL Reference below.
Secondary Method: Signed URLs
An example Signed URL
https://charturl.com/i/9yi1/area-spline?d=%7B%22options%22%3A%7B%22data%22%3A%7B%22columns%22%3A%5B%5B%22Revenue+in+%24%22%2C300%2C350%2C300%2C0%2C0%2C0%5D%2C%5B%22Customers%22%2C130%2C100%2C140%2C200%2C150%2C50%5D%5D%7D%7D%7D&s=cw7R0Nlj2VB1kYvdLF1A9h%2BICpAQ0PThzWdUE4OPohg%3D%0A
Signed URLs let you construct a URL on the fly that will instantly be turned into an image when used in an img tag. This method limits the amount of data you can send, since URLs have a max length, but here is an example URL:
Signed URLs are helpful when you can’t afford to wait for the network latency of making a call to our ShortURL endpoint.
For details on how to create a Signed URL, see the Signed URL Reference below.
Image Details
Image Formats
Images are returned as PNG files. Support for TIFF is coming soon.
Image Sizes
{
  "charturl": {"type": "chartjs"},
  "options": {
    "size": {"height": 400, "width": 600},
    "type": "bar",
    "options": {
        "title": {
            "display": true,
            "text": "Chart.js Combo Bar Line Chart"
        }
    }
  }
}
Image heights and widths should not be less than 40px. The max height and width is 1200px. Retina images will return up to 2400px. To specify height & width:
- ChartJS: Set
options.sizeto be an object withheightandwidthinteger parameters. This is not an option in the Chart.js documentation. Their docs require setting size via markup, so we’ve added it here. - C3.js & DataMaps: See the documentation for those charting libraries
Retina Image Support
We now support modifying the pixel ratio in two ways. First, you can set the
charturl.pixel_ratio in your Config JS Object. See the Config JavaScript
Reference below for more information. Second,
you can add the retina=1 parameter to any URL (Signed or Short) and a
retina-scale image will be returned.
For ease of use in stylesheets and the srcset attribute, you can also append retina=1 onto any URL and it will have the same effect as setting the charturl.pixel_ratio option.
Using srcset
The srcset attribute is a handy way to provide retina resolution options to
browsers without making them download both versions of the image. Below is an
example of how to use srcset
<img src="[url]" srcset="[url],1x [url]?retina=1 2x">
Using srcset and our retina=1 option will greatly increase the quality of
your ChartURL images on retina screens. For more information about srcset
check out this article at CSS-TRICKS.
Asset Storage
We store all images on S3.
Loading Speed
Size of the image and network speeds will obviously have an impact, but an 800x400 PNG will render on our end in around 400ms.
ChartURL Watermark Branding
The ChartURL watermark branding on images is removed once you choose any paid plan.
Custom Watermark Branding
body:before {
  content: " ";
  display: block;
  position: absolute;
  right: 0;
  bottom: 0;
  height: 20%;
  width: 40%;
  z-index: -1;
  opacity: 0.2;
  background: url(/* DATA URI */);
  background-size: contain;
  background-position: bottom right;
  max-height: 40px;
  max-width: 120px;
}
We support custom watermark branding using CSS and an image data URI. See the
example CSS on the right. We recommend setting max-width and max-height to
the size the image to avoid it looking blurry on larger images. Your logo
should be a PNG with a transparent background. To turn your image into a data
URI, use a service like this one.
Technically, you could use an external URL (to an asset on S3 for example) in
place of the background-url, but do not do that. We cannot guarantee the
images will load correctly at scale.
Caching image URLs
You’ll notice that the URLs you generate redirect to S3 urls. Do not store these S3 URLs, as we do not guarantee they will not change over time.
Reference
ShortURL Reference
Below is a full example of what you can pass into the ShortURL endpoint
{
  "template": "weekly-activity",

  "charturl": {
    "pixel_ratio": 1,
    "title": {"text": "My great title!"}
  },

  "options": {
    "data": {
      "columns": [
        ["data 1",1,2,3,4],
        ["data 2",2,3,4,5]
      ]
    }
  },

  "custom_css": "body {background-color: black}",

  "custom_js": "/* Some JS */"
}
Code examples for generating ShortURLs
require 'typhoeus'
require 'json'

url = "https://charturl.com/short-urls.json?api_key=[REDACT]"
data = {
  template: "weekly-activity",
  options: {
    data: {
      "columns": [
        ["data 1",1,2,3,4],
        ["data 2",2,3,4,5]
      ]
    }
  }
}

options = {
  headers: {'Content-Type' => 'application/json'},
  body: data.to_json
}

resp = Typhoeus::Request.post(url, options)

JSON.parse(resp)['short_url']  #=> "https://charturl.com/r/23425"
const https = require('https');

var body = JSON.stringify({
  template: 'weekly-activity',
  options: {
    data: {
      columns: [["x", "2016-01-10", "2016-01-11", "2016-01-12"], ["Steps", 1000, 1200, 1100]]
    }
  }
});

var options = {
  hostname: 'charturl.com',
  port: 443,
  path: '/short-urls.json?api_key=[REDACTED]',
  method: 'POST',
  headers: {
    "Content-Type": "application/json",
    "Content-Length": Buffer.byteLength(body)
  }
};

var req = https.request(options, (res) => {
  console.log('statusCode: ', res.statusCode);
  console.log('headers: ', res.headers);

  res.on('data', (d) => {
    process.stdout.write(d);
  });
});

req.end(body);

req.on('error', (e) => {
  console.error(e);
});
<?php

$api_key = "dak-55045dac-bb35-40ac-80c8-874ab71c6f83";
$url = 'https://charturl.com/short-urls.json?api_key=' . $api_key;

# Use `json_encode` to encode your own object into JSON
$content = '{"template": "weekly-activity", "options":{"data":{"columns":[["This Week",10,12,41,9,14,15,15],["Last Week",9,14,21,21,20,3,5]]}}}';

$curl = curl_init($url);
curl_setopt($curl, CURLOPT_HEADER, false);
curl_setopt($curl, CURLOPT_RETURNTRANSFER, true);
curl_setopt($curl, CURLOPT_HTTPHEADER,
        array("Content-type: application/json"));
curl_setopt($curl, CURLOPT_POST, true);
curl_setopt($curl, CURLOPT_POSTFIELDS, $content);

$json_response = curl_exec($curl);

$status = curl_getinfo($curl, CURLINFO_HTTP_CODE);

if ( $status != 201 ) {
    die("Error: call to URL $url failed with status $status, response $json_response, curl_error " . curl_error($curl) . ", curl_errno " . curl_errno($curl));
}

curl_close($curl);

$response = json_decode($json_response, true);

echo $response;
?>
This endpoint takes an API key, some data, and creates a ShortURL.
HTTP Request
POST https://charturl.com/short-urls.json
Query Parameters
| Key | Value |
|---|---|
api_key |
Your API key for the project your template belongs to |
Headers
| Header | Values |
|---|---|
Content-Type |
application/json |
Body
The POST body is JSON with the following attributes. To the right is an example dataset.
| Attribute | Required | Type | Description |
|---|---|---|---|
| charturl | No | Object | ChartURL specific options |
| charturl.type | No | String | Possible values: chartjs, datamaps, c3js. Default: c3js |
| charturl.pixel_ratio | Integer | Possible values: 1, 2. Default: 2 |
|
| charturl.title | Object | Add a title | |
| charturl.title.text | String | The title text. Default: (none) |
|
| template | Yes | String | The slug of a template to apply these data to |
| options | No | Object | This is the object passed to the charting library after merged with the Project- and Template-level ConfigJS settings |
| custom_css | No | String | CSS to be rendered into the page before storing the image |
| custom_js | No | String | JavaScript to be executed after the chart loads and before storing the image |
Response
Below is an example JSON response from the ShortURL endpoint
{
  "short_url": "https://charturl.com/r/23425"
}
Responses from the ShortURL endpoint are always JSON.
Signed URL Reference
Code examples for generating signed URLs
<?php
# The constants needed
$key = "dek-d7a46236eda961a6c3c18ffcc6b077ba87d27e9ae85f7842c6d427c265dd5f69d5131308d93332353d4a55a4b1160fcf516515a4a9f0aa50fbf2d7a2e7d0f1c5";
$token = "dt-RwYN";
$slug = "weekly-activity";

# The data converted to JSON
$json = '{"options":{"data":{"columns":[["This Week",10,12,41,9,14,15,15],["Last Week",9,14,21,21,20,3,5]]}}}';

# Generating the signature: http://www.jokecamp.com/blog/examples-of-creating-base64-hashes-using-hmac-sha256-in-different-languages/#php
$raw_sig = hash_hmac('sha256', $json, $key, true);
$encoded_sig = base64_encode($raw_sig);
$url = "https://charturl.com/i/" . $token . "/" . $slug . "?d=" . urlencode($json) . "&s=" . urlencode($encoded_sig);

echo '<img src="' . $url . '">';
?>
require 'json'
require 'typhoeus'
require 'openssl'
require 'base64'
require 'cgi'

key = "dek-d7a46236eda961a6c3c18ffcc6b077ba87d27e9ae85f7842c6d427c265dd5f69d5131308d93332353d4a55a4b1160fcf516515a4a9f0aa50fbf2d7a2e7d0f1c5";
token = "dt-RwYN";
slug = "weekly-activity";
data = { options: {data: {columns: [["This Week",10,12,41,9,14,15,15],["Last Week",9,14,21,21,20,3,5]]}}};
json = data.to_json

# Generating the signature: http://www.jokecamp.com/blog/examples-of-creating-base64-hashes-using-hmac-sha256-in-different-languages/#php
sig = Base64.encode64(OpenSSL::HMAC.digest('sha256', key, json))


url = "https://charturl.com/#{token}/#{slug}?d=#{CGI.escape(json)}&s=#{CGI.escape sig}"
This endpoint requires two parameters, the JSON data being passed in, and a Signature to ensure authenticity.
HTTP Request
GET https://charturl.com/i/[:project_token]/[:template_slug]
The project_token is taken from your Project. The template_slug is for your template. Format defaults to PNG, which is currently the only option.
Query Parameters
| Key | Required | Value |
|---|---|---|
d |
Yes | The CGI-escaped JSON data for your chart |
s |
Yes | A CGI-escaped, Base64-encoded SHA-256 HMAC digest of your d parameter and your ENCRYPT_KEY |
retina |
No | Include retina=1 on query string to return 2x resolution image. Do not include parameter on query string to return default image. |
Response
The response will be an image of the desired format.
Bulk API Reference
Below is an example JSON body to include in the Bulk API POST
[
  {
    "id": "1",
    "template": "quick-pie",
    "charturl":{},
    "options":{
      "data": {
        "columns": [
          ["Yes", 2],
          ["No", 3],
          ["Unsure", 6]
        ]
      },
      "size": {"width": 200}
    }
  },
  {
    "id": "2",
    "template": "weekly-activity",
    "charturl":{},
    "options":{
      "data": {
        "columns": [
          ["Last Week", 1,2,3,4,3,2,1],
          ["This Week", 22,5,1,5,1,5,6]
        ]
      }
    }
  }
]
This endpoint, which is only available at higher pricing tiers, enables you to create up to 100 ShortURLs at once.
HTTP Request
POST https://charturl.com/short-urls/bulk.json
Query Parameters
| Key | Value |
|---|---|
api_key |
Your API key for the project your template belongs to |
Headers
| Header | Values |
|---|---|
Content-Type |
application/json |
Body
The POST body is a JSON array of ShortURL objects. The ShortURL objects are the same as above,
with one exception: the addition of an id field. Each member of the array must have a unique
id field, so you can use the strings "1" to "100" for example.
Response
Below is an example JSON response from the ShortURL endpoint
{
  "short_urls": {
    "1": {"short_url": "https://charturl.com/r/23425"},
    "2": {"short_url": "https://charturl.com/r/a338h"}
  }
}
Responses from the Bulk API endpoint are always JSON.
Help us improve
Help us improve these docs!
If you have any questions, or if you have implemented logic to create Signed or Short URLs in a language other than Ruby, JavaScript, or PHP, we want to know!
Contact support and let us know what you’ve got.